HP 49/50 Plotting Utilities
The first size listed is the downloaded file size and the second size listed is the size on the calculator.
|
HP 49/50 Plotting Utilities The first size listed is the downloaded file size and the second size listed is the size on the calculator. |
There are 21 files totaling 2,020 KB in this category.
| ||||||
| ||||||
| ||||||
| ||||||
| ||||||
| ||||||
| ||||||
| ||||||
| ||||||
| ||||||
| ||||||
| ||||||
| ||||||
| ||||||
| ||||||
| ||||||
| ||||||
| ||||||
| ||||||
| ||||||
| ||||||
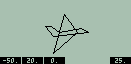 This program can rotate any 3D object given as matrix of coordinates about the x y and z axis.
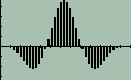 Shows the convolution of two functions graphically.
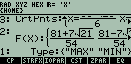 CP is a simple User RPL program that attempts to find the critical points for any given function. It also gives the local Maximum and Minimum points, and F(x) at these points. It is handy for high school students to verify they have the right answer in exams. CP also complements the built in grapher, by giving exact answers for critical points.
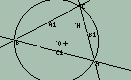 Dynamic geometry software (like geogebra). You can create geometrical figures with
lines, circles, curves and move a point. Zoom in/out, scrolling, moving a point are made in real time (with 16 grey levels). Program and documentation are in English and in French. Written with HPGCC for the 49g+ and 50g only.
Dynamic geometry software (like geogebra). You can create geometrical figures with
lines, circles, curves and move a point. Zoom in/out, scrolling, moving a point are made in real time (with 16 grey levels). Program and documentation are in English and in French. Written with HPGCC for the 49g+ and 50g only.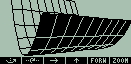 HLDRAW does what WIREFRAME should have done: fast, true photographic, hidden line removed 3D plotting. It is possible to easily adjust the viewpoint so that you can rotate the graph.
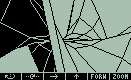 Equivalent to WIREFRAME plot, but with hidden line removal and shading of "underside" of 3D graph. For the 49g+ and 50g (ROM 2.15) only. The previous version only worked on older ROM revisions (older 49G ROMs only?). Modified to work with most current ROM. Source code has been updated as well (for on-calc compiling only).
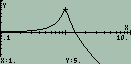 This library makes log-scale graphs for the 49G/49g+/50g. Plot types "Function", "Scatter" and "Parametric" are implemented. In the type "Function", TRACE and (X,Y) in the 49G plot menu are available. Non-uniform logarithmic tick, zoom-in, zoom-out and recenter are implemented. Faster than previous versions.
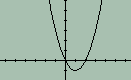 Front end to the 49's plotter that allows you to navigate around a graph, scrolling the screen.
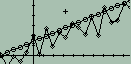 Performs Scatter plots with several different mark styles (circles, diamonds, balls, boxes, etc).