| Statistics Package (details) |
Prime ENG 2,631 KB / 51-2123 KB |
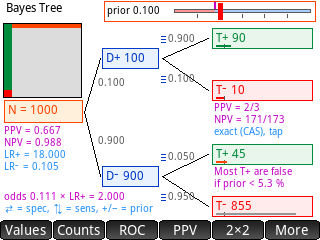 PPL programs for teaching statistics, written in PPL and MicroPython, plus field notes on PPL behavior and the Python bridge. NormExplorer (a normal-distribution workbench), Norm3 and Burr3 (drag x₀ and watch the area and the S-curve together), StatDist (27 distributions, each result a plot you can touch), StudRange (the studentized range, Tukey's q), CentralLimit (watch one sample happen, its members lighting up and their mean dropping into the pile), SampDist (the sampling distribution of x̄, with the population drawn faintly behind it), CICatcher (fifty confidence intervals stack up, blue if it catches the truth (the green line) and red if it misses), GaltonBoard (Galton's quincunx), PowerViz (drag the H₁ curve, and the α, β and power regions reshade live. Drag the critical line to set α, and drag up or down for n. n₈₀ appears in the panel and on the power-versus-n curve), ChiTable (chi-square for a 2 × 2, 2 × 3 or 3 × 2 table), TrendTest (bchi-square for linear trend in a 2 × k table), TestChooser (which statistical test? It is a tappable flowchart: tap the outcome's scale and the design, and the path draws itself to a test), EpiStats (epidemiology), ScatterLab (build a scatterplot with your finger), BiNorm3D (the bivariate normal as a wireframe you turn with a finger). |
| By Roger Metcalf. |
2026-10-19 | |